Why Your Watch's Sleep Stages Are Mostly a Guess
Dovy Paukstys
Founder, Komori Care
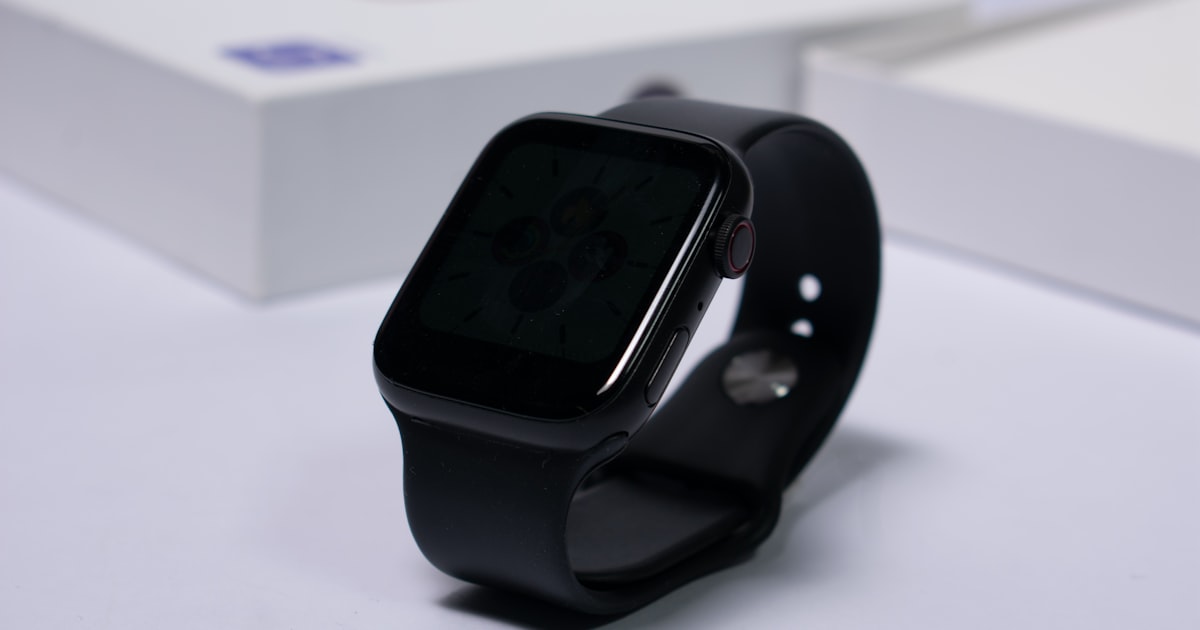
Your Watch Says You Got 1 Hour and 12 Minutes of Deep Sleep
Open the app. There's the chart. Deep sleep, 1h 12m. Light sleep, 4h 3m. REM, 1h 28m. Awake, 14m.
It looks like data. It's shaped like data. It has minutes in it, down to the minute.
Here's the question almost nobody asks: where did that number come from? Your watch has no sensors on your scalp. It has a green light on the underside and a motion sensor. From those two signals, it produced a four-way breakdown of what your brain was doing for eight hours.
That's not nothing. It's also not what a sleep lab does. And the gap between the two is a lot bigger than a clean chart makes it look.
This isn't a "throw your watch away" post. Wearables are good at some things and shaky at others, and knowing which is which changes how you use them.
Key Facts
- Across six wrist wearables tested against a sleep lab, agreement on four-stage sleep scoring ranged from fair to moderate (Cohen's kappa 0.21 to 0.53) (SLEEP Advances, 2025)
- Consumer devices are very good at spotting sleep (sensitivity 0.93 or higher) and poor at spotting wake (specificity 0.18 to 0.54) (SLEEP, 2021)
- Correctly labeled deep sleep ranged from 47% to 70% across those six wrist devices (SLEEP Advances, 2025)
- Correctly labeled REM ranged from 33% to 69% across the same devices (SLEEP Advances, 2025)
- In a test of 11 consumer trackers, overall staging scores spanned a huge range (macro F1 0.26 to 0.69) (JMIR mHealth uHealth, 2023)
- Sleep researchers describe wearable staging as "rough estimates at best" (SLEEP, 2021)
Want a follow-up on this topic? Get a note when Komori launches (2027)
One email when the contactless monitor ships, plus the occasional short follow-up on this topic. No spam, leave any time.
What a Sleep Lab Actually Measures
A sleep study, called polysomnography or PSG, puts sensors directly on the thing being measured.
Electrodes on the scalp read brain waves. That's an EEG, short for electroencephalogram — it's a voltage recording of your brain's electrical activity. Two more sensors track eye movement. Another tracks muscle tone in the chin.
A trained scorer then chops the night into 30-second chunks and labels each one: awake, N1, N2, N3, or REM. The labels come from rules about wave shapes. Sleep spindles and K-complexes mean N2. Big slow waves mean N3. Fast, awake-looking brain activity plus dead-still chin muscles plus darting eyes means REM.
The stages are defined by what the brain is doing. That's the whole point. Sleep stages are not a behavior you can watch from the outside. They're an electrical signature.
What Your Watch Actually Measures
Your wrist device measures two things, and neither is your brain.
The first is motion, from an accelerometer. It's the same chip that knows when you rotate your phone. It tells the watch how much you're moving and how vigorously.
The second is PPG, short for photoplethysmography. That's the green light on the back. It shines into your skin and measures how much light bounces back. Blood absorbs light, so the reflected amount pulses with every heartbeat. From that, the watch gets your pulse rate and the tiny timing differences between beats.
Then software guesses. Deep sleep tends to come with a slower, steadier pulse and almost no movement. REM tends to come with a more variable pulse and a paralyzed body. Light sleep is what's left over.
So the watch isn't measuring your sleep stages. It's measuring your heart and your body, then inferring what your brain was probably doing. That's a much harder problem, and the results show it.
The Scoreboard
Here's what happened when researchers put six popular wrist wearables on 62 adults during a full overnight sleep study and compared every 30-second chunk to the lab's scoring 1.
Kappa is a fairness-adjusted agreement score. It runs from 0 (no better than guessing) to 1 (perfect). In sleep research, 0.20 to 0.40 is usually called "fair," and 0.40 to 0.60 is "moderate."
| Device | Kappa (4-stage) | Light sleep correct | Deep sleep correct | REM correct |
|---|---|---|---|---|
| Apple Watch Series 8 | 0.53 | 83.3% | 50.7% | 68.6% |
| Fitbit Sense | 0.42 | 73.3% | 50.9% | 61.3% |
| Fitbit Charge 5 | 0.41 | 72.4% | 51.5% | 60.0% |
| Whoop 4.0 | 0.37 | 62.0% | 69.6% | 62.0% |
| Withings ScanWatch | 0.22 | 53.0% | 66.7% | — |
| Garmin Vivosmart 4 | 0.21 | 60.3% | 47.5% | 33.1% |
Source: Schyvens et al., SLEEP Advances, 2025 1
Read that Garmin REM row again. It labeled about a third of REM correctly. Not because Garmin is incompetent — the whole category is hard.
Notice something else: no device wins everywhere. Whoop was the best of the group at deep sleep and near the bottom at light sleep. Apple was the best at light sleep and middle of the pack at deep. These devices aren't more or less accurate versions of each other. They're making different tradeoffs, silently.
An earlier study of seven devices found the same shape of problem. Almost every device significantly overestimated light sleep, and several underestimated REM 2.
And this isn't one unlucky lab. A separate multicenter study put 11 consumer trackers — watches, bedside units, and phone apps — against sleep studies across 349,114 thirty-second chunks. Overall staging performance ranged from a macro F1 of 0.26 at the bottom to 0.69 at the top 3. Same category, wildly different quality, no label on the box telling you which one you bought.
N1 Is the Hardest Stage in the Business
If you want to know why four-stage scoring is so much harder than it looks, look at N1.
N1 is the drowsy transition between awake and asleep. It usually makes up only about 2% to 5% of a healthy adult's night, and it comes in short scattered bursts rather than long blocks. Your consumer app almost never shows it separately — it gets folded into "light sleep" along with N2.
N1 is hard even for the models that get to see actual brain waves. A 2026 preprint (not yet peer reviewed) on a new EEG-based staging model describes "unsatisfactory recognition accuracy for hard categories such as the N1 stage" as a standing problem in the field, and treats better N1 performance as the bar to clear 4.
If N1 is still a headache with electrodes on your scalp, a green light on your wrist is not solving it. And because N1 sits right on the boundary between awake and asleep, errors there ripple straight into your total sleep time.
The Part They're Actually Good At
Now the fair half.
Wearables are strong at telling sleep from wake. In the seven-device study, every device caught sleep with a sensitivity of at least 0.93 2. Translation: when you were asleep, the device almost always agreed.
The weak side is wake. Specificity in that study ran from 0.18 to 0.54 2. Translation: when you were lying awake in bed, most devices thought you were asleep well over half the time. If you're a light sleeper who stares at the ceiling for 40 minutes at 3am, your watch is probably not giving you credit for that.
This shows up in the research literature too. A December 2025 preprint (not yet peer reviewed) trained a deep learning model on wrist motion alone in 453 adults wearing three different accelerometer brands during clinical sleep studies. Their model reached an F1 score of 0.86, with sleep sensitivity of 0.87 and wake specificity of 0.78 5. That wake number is much better than what the consumer devices manage — and it's still the hardest part of the job for a purpose-built research model.
If you want a deeper comparison of the sensing approaches, we wrote one up in how sleep tracking methods actually compare.
Where the Research Is Right Now
Sleep staging from PPG is an active research problem, not a solved one.
An August 2026 preprint (not yet peer reviewed) reviewing PPG-based sleep staging states it plainly: "PPG-based staging trails EEG-based methods by a substantial margin" 6. The authors argue the gap is partly a task-design problem, not just a sensor problem, and propose a new labeling approach that improved four-class accuracy by 3.7 to 5.7 percentage points across four different model architectures.
Those are real improvements. They're also the kind of numbers that tell you where the field is: still chasing a few points at a time on a problem that starts well behind EEG. Meanwhile the EEG side of the field is moving fast.
Meanwhile, the devices on shelves right now update their staging algorithms through firmware. A sleep research editorial makes this point well — "validation is not an event, it is a process," because "devices change, as does their use and both the hardware and software that support them" 7. The study that validated your watch may have tested an algorithm your watch no longer runs.
So What Do You Do With the Number?
Use it as a trend, not a verdict.
Trust it for: whether you went to bed earlier this week than last week, roughly how long you were in bed, whether your total sleep time is drifting down over a month, whether last night was unusually restless.
Don't trust it for: "I only got 42 minutes of deep sleep, something is wrong with me." That single-night stage number carries far more error than the app's clean chart implies. Two people with identical brain recordings could get meaningfully different stage breakdowns from two different watches. You saw the table.
And if the number is making you anxious, that's a real thing with a real name. Chasing perfect tracker numbers can make sleep worse, which we covered in orthosomnia and sleep tracking anxiety.
None of this makes a wearable useless. It makes it a trend instrument being read as a precision instrument.
Where Komori Fits
Komori is taking a different route, and it's worth being direct about what that does and doesn't buy you.
Komori is being built as a contactless device that senses from above the bed — no wearable, no camera. It's designed to report sleep position, movement and restlessness, bed-exit events, and what your room is doing overnight: temperature, humidity, CO2, light, and noise. It's a general wellness device, not a medical or diagnostic one.
It is not designed to hand you a four-stage hypnogram. That's a deliberate choice, not a missing feature. We'd rather report things a sensor can observe directly than publish a confident-looking stage breakdown built on an inference chain. It's the same reasoning behind why we don't give you a single sleep score.
Position, movement, and room conditions are measurable. Whether your brain was in N2 or N3 at 2:14am, from a device across the room, is not.
If your sleep is bad enough that the stage numbers feel urgent, the number isn't the problem to solve. Talk to a doctor, and if a sleep study is on the table, that's the tool built to answer this question.
Keep reading
- HRV and sleep — what HRV is commonly used for, and what it does not tell you.
- The first-night effect — worth reading alongside any accuracy comparison.
- Why your phone can tell you slept badly: researchers using phone taps and typing as a sleep proxy, and where it breaks down.
Footnotes
-
Schyvens AM, et al. "A performance validation of six commercial wrist-worn wearable sleep-tracking devices for sleep stage scoring compared to polysomnography." SLEEP Advances, 2025. ↩ ↩2
-
Chinoy ED, et al. "Performance of seven consumer sleep-tracking devices compared with polysomnography." SLEEP, 2021. ↩ ↩2 ↩3
-
Lee T, et al. "Accuracy of 11 Wearable, Nearable, and Airable Consumer Sleep Trackers: Prospective Multicenter Validation Study." JMIR mHealth and uHealth, 2023. ↩
-
Wang C, Gao J. "SWINSleepNet: A Hierarchical Context-Aware Framework for Sleep Staging." arXiv preprint, August 2026. Not peer reviewed. ↩
-
Montazeri N, et al. "A robust generalizable device-agnostic deep learning model for sleep-wake determination from triaxial wrist accelerometry." arXiv preprint, December 2025. Not peer reviewed. ↩
-
Zheng S, et al. "Rethinking PPG-based Sleep Staging: Datasets, Metrics, and Benchmarks." arXiv preprint, August 2026. Not peer reviewed. ↩
-
Grandner MA, Lujan MR, Ghani SB. "Sleep-tracking technology in scientific research: looking to the future." SLEEP, 2021. ↩
Want a follow-up on this topic? Get a note when Komori launches (2027)
One email when the contactless monitor ships, plus the occasional short follow-up on this topic. No spam, leave any time.
Keep reading
Want to see your sleep position data?
Join the free waitlist for launch updates. Or lock in founder pricing with the Insider Pass ($49, credited toward your purchase).